Dashboard
Introduction
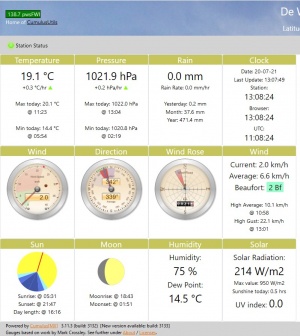
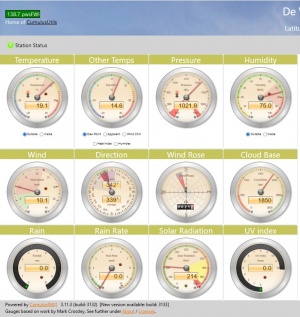
The dashboard is the left part of the CumulusUtils Website as generated by the Website Generator. The Dashboard contains twentyfour panels of which twelve can be displayed at the same time. The menu choice Toggle Dashboard changes between the two sets of panels. It is fixed part of the website and cannot be removed (just like the reportview on the right).
Examples of the two dashboards are shown on the right.
The Dashboard is configurable in two ways: the contents of a panel and - only if you use the ChartsCompiler - the click event attached to a panel. Because click events are not configurable in the default configuration, it is advised NOT to change the panel content when not using CDL (but you're free to experiment).
The part of the CumulusUtils interface to the right of the Dashboard is the part where the Charts and reports are shown. In the terminology of the CUtils that is the ReportView.
Dashboard configuration
To understand the configuration well the user needs first to understand the enumeration of the panels.
The panels are enumerated from left to right and from top to bottom. So the first dashboard which shows at startup of the website has panel nr 1 on top left (default content is Temperature) and panel nr 12 on bottom right (default content is Solar). The second dashboard has panel nr 13 on top left (default content is Temperature Gauge) and panel nr 24 on bottom right (default content is UV Gauge).
Beside this functional configuration the colouring as well can be adjusted. It is assumed the parameter naming is clear enough in this respect.
Content configuration
All panels can be assigned a block of predefined content which can be seen in the default configuration. The content itself is not user definable (and probably never will be). The cumulusutils.ini file has parameters for each panel (e.g. panel-1) in the Section Website. Assigning keywords to those parameters sets the content for that panel. E.g. panel-1=TemperatureGauge and panel-13=TemperatureText interchanges the gauge and text information panel content for the top-left panel in both dashboard toggles.
When errors are made in the keywords (e.g. typos) an error is written in the logfile and the panel remains empty.
The existing content (the block names) and their default panel assignment is given below:
Panel-1=TemperatureText
Panel-2=PressureText
Panel-3=RainText
Panel-4=Clocks
Panel-5=WindGauge1
Panel-6=WindDirGauge1
Panel-7=WindRoseGauge1
Panel-8=WindText
Panel-9=SolarDisc
Panel-10=LunarDisc
Panel-11=HumidityText
Panel-12=SolarText
Panel-13=TemperatureGauge
Panel-14=OtherTempsGauge
Panel-15=PressureGauge
Panel-16=HumidityGauge
Panel-17=WindGauge2
Panel-18=WindDirGauge2
Panel-19=WindRoseGauge2
Panel-20=CloudBaseGauge
Panel-21=RainGauge
Panel-22=RainSpeedGauge
Panel-23=SolarGauge
Panel-24=UVGauge
You can replace any panel content with the content specification Empty. This will blank that specific pane (in the background colour and an empty header) but not move the others. NOTE: Contrary to the CMX standard, there is no need to configure FeelsLike anywhere. Both Apparent and Feels Like can be displayed. See page for Feels Like.
Event configuration
Each panel may have a click event attached to it: if a mouse click is received on that panel a predefined chart is displayed in the ReportView. There is a default set of events which is used if there is no ChartsCompiler used. Those events are:
['Temp','Pression','Rain',,'WindSpeed','WindDir','WindDir','WindSpeed',,,'Humidity','Solar','Temp','Temp','Pression','Humidity',,,,,'Rain','Rain','Solar','Solar']
Each of the 24 strings - separated by comma's - describes the chart which will be displayed when clicked. So if you interchange panel-1 and panel-2 (temperature and pressure) and you click on pressure you will see the temperature chart. These event/chart combinations cannot be changed by the user.
However, when using the ChartsCompiler / CDL combination, you can assign a chart to a Panel with the ConnectsTo construct.
An example of this you see here:
Chart Oversight Title Oversight of current weather status ConnectsTo 2 4 15 20
  PLOT Temperature Colour #058DC7 zindex 90
  PLOT DewPoint Colour #50B432 zindex 80
  PLOT pressure Colour red zindex 70
  Plot Humidity Colour #64E572 zindex 60
  Plot SolarRadiation As Area Opacity 0.2 Colour Orange zindex 20
  Plot RainFall As Area colour #33B4FF opacity 0.2 zindex 10
EndChart
So when panel-2 is clicked (the default content would be pressure) you get this chart. But this also is valid for panel 4 (clocks), 15 (Pressure gauge) and 20 (Cloudbase gauge). So combining the panel configuration of the dashboard with the event configuration of the ChartsCompiler gives the user almost full control of how the website functions.
The Gauges
The gauges can be configured for appearance as described on the Website page. You may find examples here and here. Please study the Steelseries FAQ for the values of the parameters.
The Wind Gauges
As you see, there are two sets of wind gauges. The reason for this is that it is not possible to create a second gauge object (for any gauge). Therefore, the existing object is moved between the first and the second dashboard during a toggle because we need the wind gauges in both dashboards. For the first dashboard you use the denominator 1 (e.g. WindGauge1) and for the second dashboard you use denominator 2 (e.g. WindGauge2). Mixing and moving these out of the dashboard will give unpredictable results.
The Lunar Disc
The Lunar Disc native to CumulusUtils is an abstraction of the phases of the moon calculated and refreshed each hour. This is the preferred default (for aesthetic uniformity and good taste ;) )
However, some prefer the real moon image as delivered by CMX itself. This is possible in CumulusUtils by setting the inifile parameter UseCMXMoonImage in section [Website] to true. Note that you have to configure the use of this image in CMX and that CumulusUtils uses the actual path configured there (as a path relative to the webroot of CumulusUtils).
The PwsFWI button
PwsFWI is an identifying feature of CumulusUtils displaying a pretty accurate Forest Fire Risk Assessment Index for Personal Weather Stations and therefore can't be removed from Cutils. Default the pwsFWI button is displayed in the header but it can be configured to be in the menu bar (the navbar). For how to configure read the website page

