Charts - Rain charts
From Cumulus Wiki
Jump to navigationJump to search
Introduction
The Rain charts submodule consists of four charts:
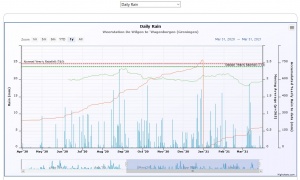
- Daily Rain - Plotting the rainfall for every day in the dayfile;
- Monthly Rain - Plotting the monthly rainfall for every year in the dayfile
- Yearly Rain statistics - Plotting the average, range and standard deviation for for the rainfall in every year
- Yearly Rain statistics per month = plotting the average, range and standard deviation for for the rainfall in each month in every year
Below you will find an example image of each chart and an explanation of the origin of the numbers
Daily Rain
The chart is a timeseries of rainfall. Every day it rained it is plotted in the chart as column. The cumulative value of the rain starts january 1 at zero and augments with every amount measured until 31 december after which it resets to zero. Also visible is a moving average with a configurable period (default is 180 days).
A red dotted horizontal line shows the
